Results
The leaderboard, the significance test, and calibration against SOTA.
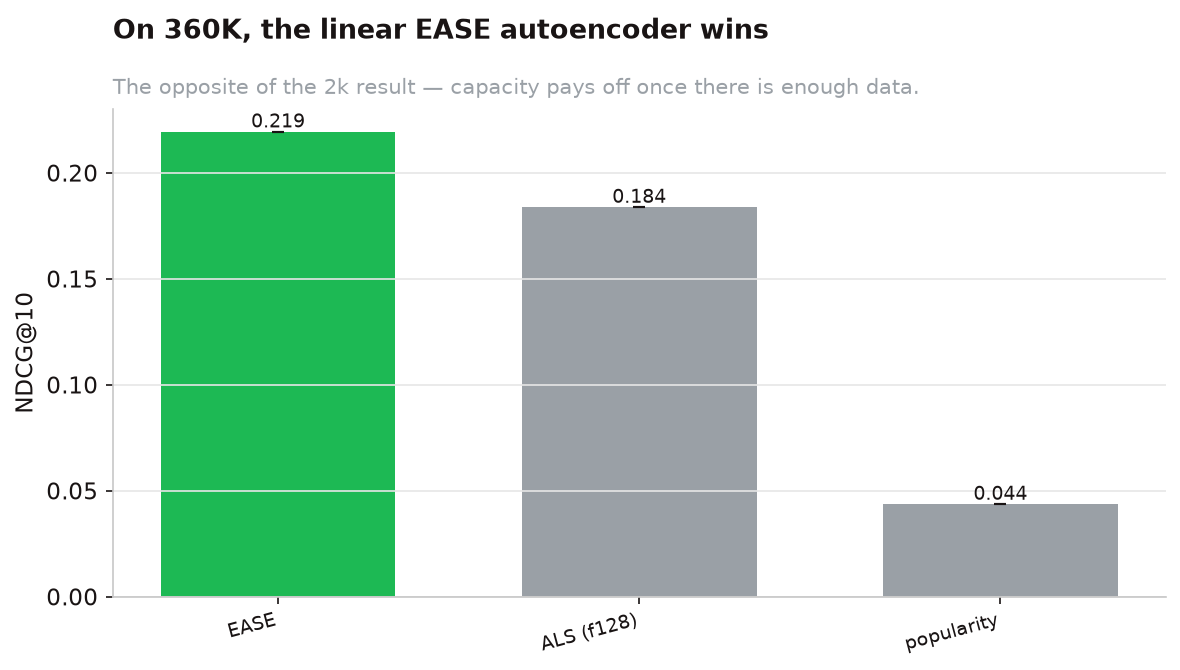
On the real 360K data, the linear EASE autoencoder wins the model comparison, significantly. And its honest full-ranking numbers sit in the published state-of-the-art band. It is the served model.
The leaderboard
NDCG@10 on the held-out Last.fm-360K split, full-catalogue ranking. Every contender ran through the same frozen split and metrics; EASE was chosen because it won, not by preference.
| Model | NDCG@10 | MAP@10 | Recall@10 | |
|---|---|---|---|---|
| EASE | 0.219 | 0.112 | 0.194 | served |
| Mult-VAE (deep) | 0.194 | 0.094 | 0.178 | |
| ALS (128 factors) | 0.184 | 0.089 | 0.163 | |
| item-item BM25 | 0.110 | 0.047 | 0.102 | |
| popularity | 0.044 | 0.017 | 0.039 |
The lead is significant
Paired, user-level bootstraps (5,000 resamples) on per-user NDCG@10 confirm every margin is real, not noise:
- EASE − ALS = +0.036: 95% CI [0.034, 0.037], p < 0.001.
- EASE − Mult-VAE = +0.026: 95% CI [0.025, 0.027], p < 0.001. EASE beats the deep model too.
- Mult-VAE − ALS = +0.010: 95% CI [0.008, 0.011], p < 0.001. The properly-trained deep model does overtake tuned ALS on real data (see the pivot).
Is 0.22 low? Calibration against SOTA
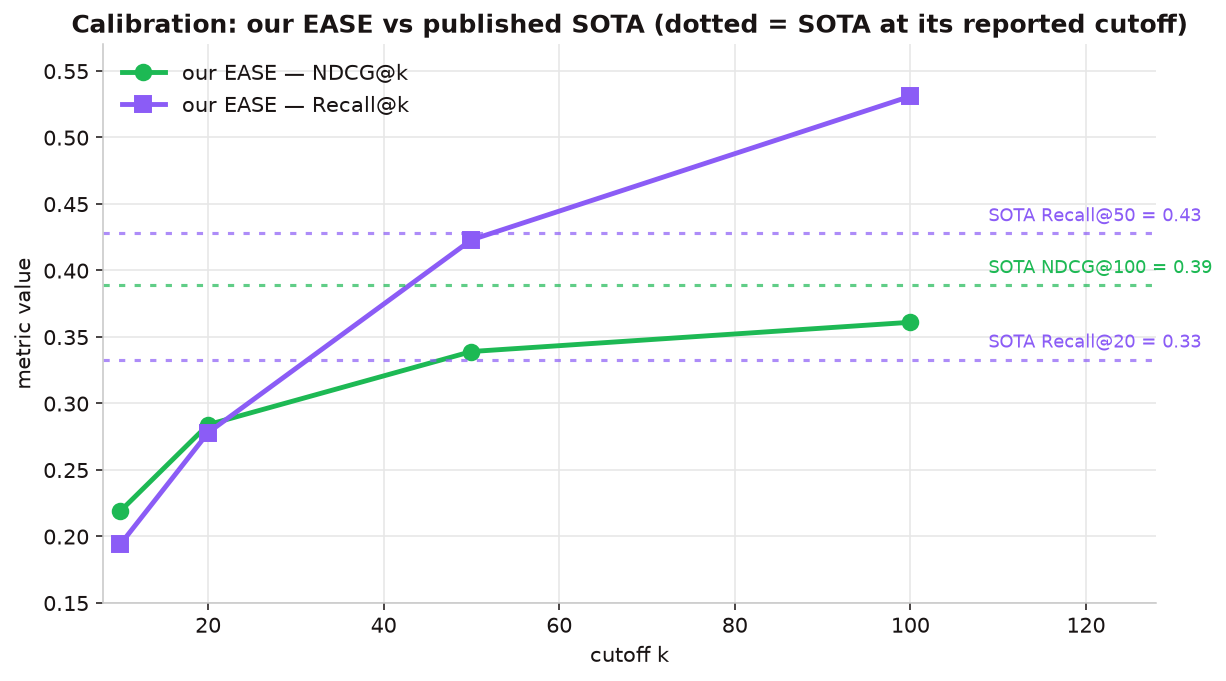
NDCG@10 reads low only because we rank the full catalogue at a tight cutoff. As the cutoff k grows, the numbers rise into the band published for the comparable Million Song Dataset (MSD):
| Cutoff | Our EASE (NDCG) | Our EASE (Recall) |
|---|---|---|
| @10 | 0.219 | 0.194 |
| @20 | 0.284 | 0.278 |
| @50 | 0.339 | 0.423 |
| @100 | 0.361 | 0.531 |
Published SOTA references on MSD: EASE NDCG@100 ≈ 0.39, Recall@50 ≈ 0.43, Recall@20 ≈ 0.33. The dotted lines below mark each SOTA value at the cutoff where it is actually published, so we compare like-for-like, not a @10 point against a @100 line. Our curve reaches SOTA where SOTA is reported: the “0.22@10” that looks low is simply the tightest-cutoff view of a strong ranker.
Beyond accuracy, and the accuracy-vs-coverage frontier
Accuracy is not the whole story: a model that only ever recommends the ten most popular artists can score respectably while being useless for discovery. So we also measure coverage (how much of the catalogue is ever recommended) and novelty (how rare the recommended artists are), over the full held-out set at k = 10:
| Model | NDCG@10 | Catalog coverage | Novelty (bits) |
|---|---|---|---|
| EASE (served) | 0.219 | 0.419 | 5.26 |
| Mult-VAE (deep) | 0.194 | 0.811 | 6.09 |
| ALS | 0.184 | 0.188 | 5.64 |
| item-item BM25 | 0.110 | 0.091 | 3.65 |
| popularity | 0.044 | 0.002 | 3.16 |
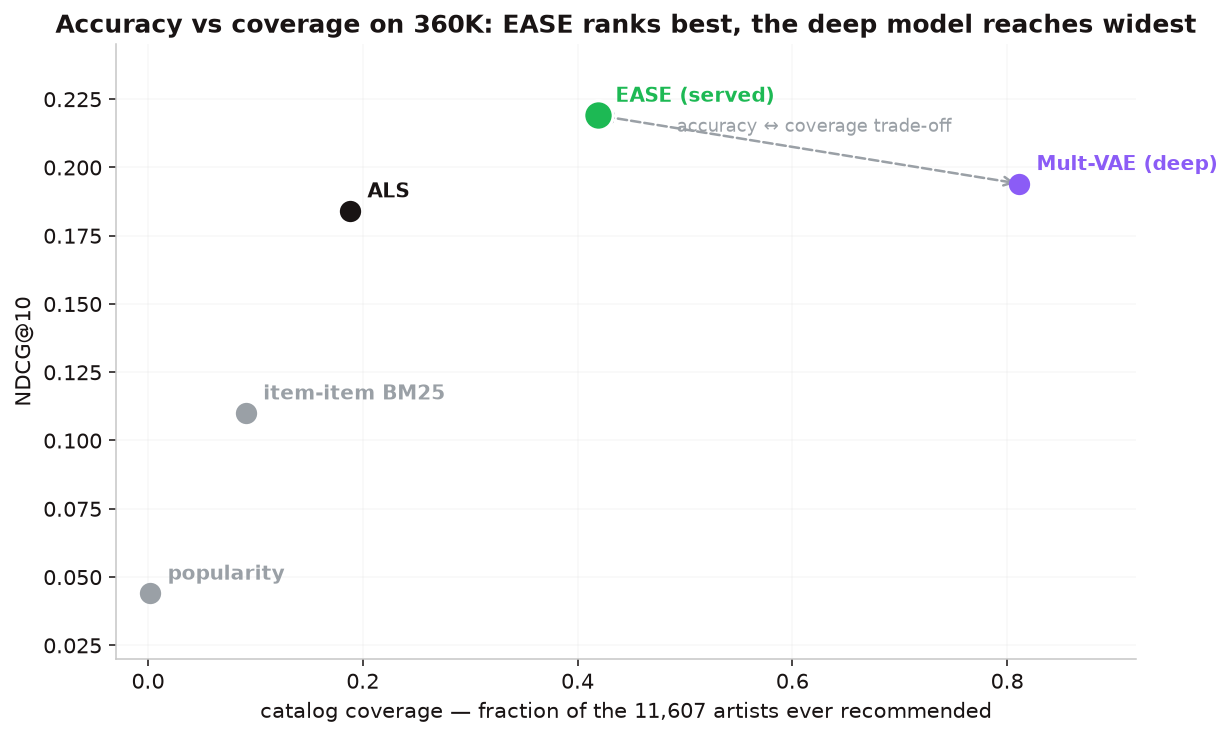
This is the accuracy-vs-discovery frontier, and it settles a tempting intuition: more coverage does not buy more accuracy. The deep Mult-VAE covers 81% of the catalogue to EASE’s 42%, nearly double, and it surfaces rarer artists, yet its NDCG@10 is lower (0.194 vs 0.219). Pushing recommendations out into the long tail trades top-10 precision for reach; it is a product choice, not a free win. The API exposes a diversity parameter (MMR re-ranking) as the runtime lever on exactly this trade-off, rather than hard-coding a single point on the frontier.
A note on the coverage number. Coverage grows with how many users you aggregate over, so it must be quoted against a fixed population, these figures are measured over the entire held-out set of 39,499 users, not a small sample.
Robustness on the locked holdout
Re-reading the sealed holdout once, trained on the full pool, the served configuration generalises with no sign of overfitting, the search-visible numbers held up on data no decision ever touched.